37 Demo
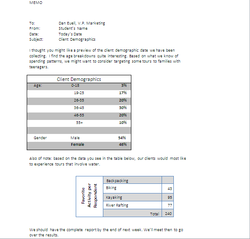
In this assignment we had to plug in information on graphs about client demographics and the favorite activity for tours.
The skills that I used were the Graphing tables, I drew one 3x5 table graph and one 3x10 graph. I also used the shading tool to shade in every other box in my graph.
What I learned from this excercise was how to properly draw a grid and graph too organize information into coloumns and boxes.
The one thing that I did well in this assignment was making the graphs, I made the graphs both different sizes, one was tall and skinny and one was smaller and wide.
What I would do the next time I make graphs in Microsoft Word is to customize the lines and shading inside of each table, this would make the graphs more interesting too people and show creativity.
53 voyager
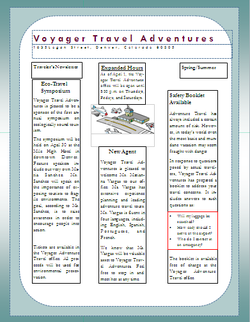
In this assignment we had to take a newspaper arrangement from Microsoft Publisher and make our own design for a flyer on a traveling company.
The skills that I used were drawing a text box, allowing me to neatly organize different things about the company and information that is need to know.
The one thing that I learned was how you can use other types of arrangements and layouts to help you get started on what you wanna do.
The one thing that i did well on for this assignment was making the boxes each have a heading for the information needed so that the reader would know what they are reading.
What I would do next time on a project like this is make the layout more interesting and make the flyer look interesting to look at and make people want to read it.
12 TEen USA Payroll
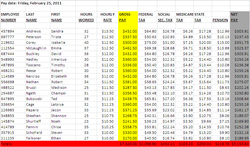
In this assignment we had too find the amount of money that teens made hourly with how many hours that they had worked. After we found out how much they made in total I had to deduct the necessary taxes with the total amount of money made.
The skills that I used in Excel were formulas, highlighting text boxes, and auto feed. Every one of these features helped by either filling in the correct amount of deduction of taxes to helping the reader visual the amount of money made.
The one most important thing that I learned was that instead of doing all of the work out, you can just add a formula in the box and it will do the math for you.Then you easily just drop down the auto feed and all your information is completed.
The one thing that I did well on in this project was making the information organized and easy to read, also I highlighted the most important parts of the graph that have critical information.
What I would do next time on a project like this is find more numbers that could be important to how much the person made or loses in their regular salary.
Career Exploration
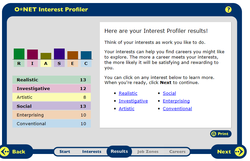
In this asignment we got to take a test and depending on the score that you got in each section was the type of job that you might be best in.
The skills that I used were making text boxes and formating cells. Both of these skills helped me with organizing my information and making the information easier to read.
The most important thing that I learned from this was that you can format graphs to have a certain font or font size in the whole table.
The one thing that I thought I did very well was putting 8 pages of information into one graph organizing it into a box that you can easily read because of the labels.
The one thing that I would do different on a project like this is make the sorted information a little bit neater, I would like to make it so that the reader can see the job and what they have to do and specialize in to get the job they want.
